R. Song,1,2 W. Xu,2 Y. Chen,2 Z. Li,2 Y. Zeng,1 Y. Fu1
1Laboratory of Cell Senescence, Shantou University Medical College, Shantou; 2Department of Endocrinology, the First Affiliated Hospital of Shantou University Medical College, Shantou, China
Correspondence: Dr. Wen-can Xu, the First Affiliated Hospital of Shantou University Medical College, Shantou, 515041 China.
Tel. +86.754.88905428 - Fax: +86.754.8259850.
E-mail: xuwcan@163.com
Key words: SIRT1, SIRT4, type 2 diabetes, peripheral blood leukocytes, pancreatic islet β-cell.
Acknowledgements: this work was supported by the Natural Science Foundation of Guangdong Province (Project No. 10151503102000017) and the Science and Technology Planning Project of Guangdong Province (Project No. 2008B0303013 69).
Received for publication: 14 December 2010.
Accepted for publication: 22 February 2011.
This work is licensed under a Creative Commons Attribution 3.0 License (by-nc 3.0).
©Copyright R. Song et al., 2011
Licensee PAGEPress, Italy
European Journal of Histochemistry 2011; 55:e10
doi:10.4081/ejh.2011.e10
AbstractThis study was designed to investigate the relationship between SIRTs 1 and 4 in peripheral blood leukocytes (PBLs) and human type 2 diabetes mellitus (T2DM). SIRTs 1 and 4 have been confirmed to be associated with homeostasis of glucose/lipid metabolism, but their roles in T2DM are still poorly understood. Peripheral blood and biochemical data were collected from 52 healthy individuals (normal control group, NC group) and 113 cases of T2DM patients. Immunocytochemical staining was used to detect SIRT1 and SIRT4 and reverse transcription polymerase chain reaction (RT-PCR) was used to detect SIRT1 or SIRT4 mRNA levels in PBLs. Immunocytochemical staining showed that SIRT1 is expressed in both nucleus and cytoplasm, and SIRT4 in the cytoplasm of granulocytes and monocytes. No SIRT1 or SIRT4 was found in lymphocytes. RT-PCR showed that SIRT1 and SIRT4 mRNA levels in T2DM group were lower than those in NC group (P<0.01). Correlation analysis showed that there is a negative correlation between SIRTs 1 and 4 and fasting plasma glucose (FPG) (P<0.05) (r=-0.161 and -0.156), a positive correlation between SIRT4 mRNA levels and triglyceride (TG)/lipoprotein a (LPa) levels (P<0.05), and a negative correlation between SIRT4 mRNA levels and high density lipoprotein cholesterol (HDL) (P<0.05). SIRTs 1 and 4 may have a role in the pathogenesis of T2DM and their expression in granulocytes and monocytes may indirectly reflect the homeostasis of glucose/lipid metabolism in T2DM. |
With the improvement of living standards, population aging, and the rise in obesity, the incidence of diabetes is annually increasing worldwide. Type 2 diabetes mellitus (T2DM) is an age-related disease. Multiple risk factors associated with aging, including scarce physical activity and weight gain, together with the increase of complications following multiple drug application and coexistence with chronic diseases, may lead to pancreatic islet β-cell dysfunction, insulin resistance and impaired glucose tolerance, and even lead to the occurrence of T2DM. Although the underlying mechanism behind aging is still unclear, current research has shown that caloric restriction (CR) is the most effective measure to slow the aging process and delay the occurrence of many age-related diseases and even extend lives of lower organisms (yeast, nematodes, fruit flies) and mammals.1 Several studies showed that CR plays an important role mainly through the signaling pathways of silent information regulator (Sir2).2 Sir2, a histone deacetylase, has been shown to play a key role in the CR-mediated slowing down of aging in yeast and nematodes.3 Homologous genes of Sir2 in mammals are named sirtuins (SIRTs), and include SIRTs 1-7.4
Researches have shown that SIRT1 can adjust the deacetylase activity of a variety of transcription factors that control many metabolic and endocrine signals, and is widely involved in the regulation of mammalian cell life span, insulin secretion, and glucose/lipid metabolism;5 SIRT4 regulates insulin secretion and affects glucose metabolism by inhibiting GDH regulation.6 Since T2DM involves the imbalance of glucose/lipid metabolism, and SIRTs 1 and 4 play key roles in maintaining the balance of glucose/lipid metabolism,7 it is likely that the expression of SIRTs 1 and 4 may be associated with T2DM.
T2DM occurs along with β-cell aging, insulin secretion reduction and blood glucose increase. Current drug therapies focus, on one hand, on promoting β-cell insulin secretion and, on the other hand, on increasing the sensitivity of target organs to insulin, protecting β-cell function, preventing aging, and then regulating glucose/lipid metabolism and prolonging life. Therefore a close relationship exists between the clinical characteristics of T2DM and β-cell function, whose assessment could represent a rapid and simple marker for monitoring the disease course and severity, as well as the effect of drug treatment. Studies have found that SIRT1 is expressed in the liver, brain, kidney, fat, muscle tissue, and relatively and uniformly expressed in islet β-cells, but not in pancreatic exocrine cells,8 while SIRT4 is expressed in the pancreatic islets.9 However, it is still unclear whether SIRTs 1 and 4 are expressed in peripheral blood leukocytes (PBLs, including granulocytes, monocytes, lymphocytes), and if a relationship exists between SIRTs 1 and 4 expressions in the PBLs and energy metabolism. Evidence indicates that in CR condition, mammals up-regulate SIRT1 and down-regulate SIRT4 within the pancreas.10 At the early stage of T2DM, insulin resistance occurs along with the damage of β-cell, and decreased expression of SIRTs 1 and 4.7 Most of the above studies were performed in animals, and no research on SIRT1 or SIRT4 expression in T2DM patients has been reported. This study was designed to investigate the relationship between SIRT1 and SIRT4 in PBLs and T2DM, and to observe whether SIRTs expression in PBLs reflects the homeostasis of glucose/lipid metabolism and the function of β-cell, which is of great significance for prevention, detection and treatment of T2DM.
One hundred and thirteen T2DM patients [57 males, 56 females, aged 45-75 years (62.01±8.67 years)], who were hospitalized in the First Affiliated Hospital of Shantou University Medical College from March to October in 2010 were involved in this study; all patients met the 1999 WHO diagnostic criteria for diabetes. Fifty-two normal healthy individuals [32 males, 20 females, aged 45-75 years (59.58 ±11.28 years)], who came to the First Affiliated Hospital of Shantou University Medical College for healthy physical examination from March to October in 2010, were designed as the control group. Every patient and control subject signed an informed consent form. The study protocol was approved by the Independent Ethics Committee of the First Affiliated Hospital of Shantou University Medical College and was performed in accordance with the Declaration of Helsinki.
Peripheral blood and biochemical data were collected from every patients and control subjects.
Fresh anticoagulated peripheral blood (3 mL) was collected from each subject, and after being centrifuged for 5 min at 1000 rpm, the supernatant was discarded, then added 6-10 times volumes of red blood cell (RBC) lysis solution (KHCO3 1.0 g, NH4Cl 8.3 g, EDTA-Na 0.037 g, add water to 1000 mL), mixed gently, and allowed RBC lysis for 4-5 min. Then the solution was centrifuged for 5 min at 1000 rpm, the supernatant was discarded again. The cell population was washed twice with phosphate buffered saline (PBS). Total RNA was extracted and used for RT-PCR using standard methods.
Immunocytochemical staining was performed on peripheral blood smear to detect SIRT1 and SIRT4 protein expression by using anti-SIRT1 or SIRT4 antibodies (1:100, Santa Cruz Biotechnology, Inc., Santa Cruz, CA, USA) with an overnight incubation at 4°C. The samples were then incubated with a secondary antibody at 1:200 dilution (biotinylated anti-rabbit or anti-goat IgG, Jackson ImmunoResearch Corporation, West Grove, PA, USA) at room temperature for 1 h, then with avidin-biotin-horseradish peroxidase complex (Promega Corporation, Madison, WI, USA) at room temperature for 30 min, and visualized with amine nickel sulfate-enhanced 3,3’-diaminobenzidine (DAB). Cells were then counterstained with hematoxylin-eosin staining (HE). The sample was observed under a light microscope, and positive staining was shown by the development of brown particles. PBS was used instead of the primary antibody for negative control reactions.
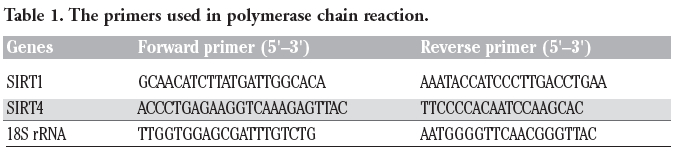
Reverse transcription polymerase chain reaction (RT-PCR) was used to detect the relative expression levels of SIRT1 and SIRT4 mRNA in PBLs. Total RNA was isolated from PBLs using the RNA simple Total RNA Kit (Tiangen, Beijing, China). First-strand cDNAs were generated by using EasyScript First-Stand cDNA Synthesis SuperMix Kit (TransGen Biotech Ltd., Andhra Pradesh, India). Primer sequences (Genecore, Shanghai, China) are shown in Table 1. After cDNA synthesis, the PCR assays were carried out using 2× EasyTaq PCR SuperMix kit (TransGen Biotech), for 35 cycles of denaturing at 94°C for 30 s, annealing at 53°C for 30 s, extension at 72°C for 1 min, and further 10 min at 72°C in the last cycle. PCR products were subjected to 1.5% agarose gel electrophoresis and visualized with ethidium bromide. Relative expression was quantified densitometrically using the Gel Image Ver. 3.74 System (Tianon, Shanghai, China).
|
Table 1. The primers used in polymerase chain reaction. |
Statistical analysis was performed with SPSS15.0 Statistical software. All values were expressed as the mean ± standard deviation. The statistical analysis was done by unpaired or paired t-test and comparisons were made by the χ2- test. Linear correlation was used for correlative analysis; differences with P<0.05 were considered as statistically significant.
Body mass index (BMI), systolic blood pressure (SBP), and diastolic blood pressure (DBP) in the T2DM group were significantly higher than those in the NC group (P<0.01). There was no significant difference in gender composition between the T2DM group and NC group (P>0.05) (Table 2).
Statistics results showed that fasting plasma glucose (FPG), triglyceride (TG) and lipoprotein a (LPa) in T2DM group were significantly higher than those in NC group (P<0.01) (Table 3; Figure 1). Total cholesterol (TC), high density lipoprotein (HDL), and low density lipoprotein (LDL) in both groups were no significantly different (P>0.05) (Table 3). Liver (AST, ALT, GGT) and renal function (BUN, Cr, UA) tests revealed no differences between the two groups (P>0.05). PBLs number in T2DM group (7.52±1.69)x109/L was significantly higher than that in the NC group (6.58±1.47)x109/L (P<0.01).
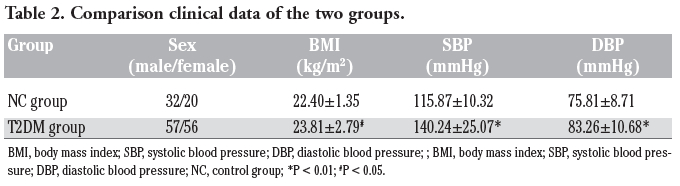 |
Table 2. Comparison clinical data of the two groups. |
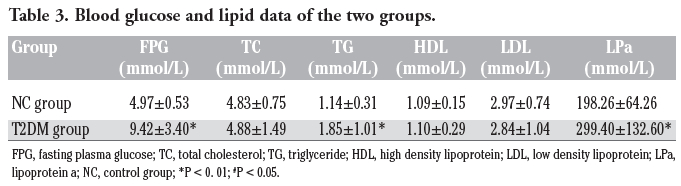 |
Table 3. Blood glucose and lipid data of the two groups. |
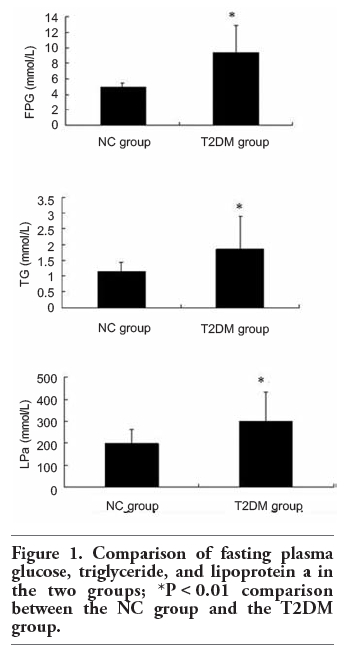 |
Figure 1. Comparison of fasting plasma glucose, triglyceride, and lipoprotein a in the two groups; *P<0.01 comparison between the NC group and the T2DM group. |
The brown reaction products in the nucleus/cell membrane or cytoplasm represent SIRTs 1 and 4 protein expression location. The results show that SIRT1 is expressed in the nucleus and cytoplasm of granulocytes and monocytes, and SIRT4 is mainly expressed in the cytoplasm of these cell types; on the contrary, the expression of SIRTs 1 and 4 was not obvious in lymphocytes (Figure 2).
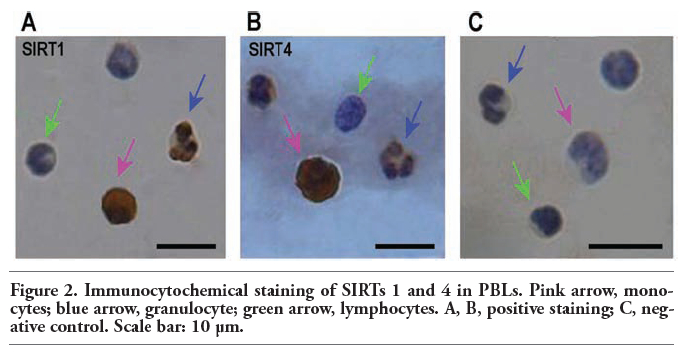 |
Figure 2. Immunocytochemical staining of SIRTs 1 and 4 in PBLs. Pink arrow, monocytes; blue arrow, granulocyte; green arrow, lymphocytes. A, B, positive staining; C, negative control. Scale bar: 10 μm. |
SIRTs 1 and 4 mRNA levels in the T2DM group are significantly lower than those in NC group (P<0.01) (Figure 3).
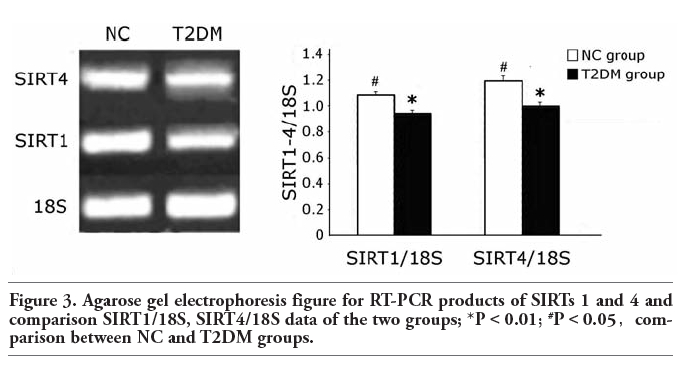 |
Figure 3. Agarose gel electrophoresis figure for RT-PCR products of SIRTs 1 and 4 and comparison SIRT1/18S, SIRT4/18S data of the two groups; *P<0.01; #P<0.05,comparison between NC and T2DM groups. |
Correlation analysis (Table 4) showed that there is a negative correlation between SIRTs 1 and 4 and fasting plasma glucose levels (FPG) (P<0.05) (r=-0.161 and -0.156), a positive correlation between SIRT4 mRNA levels and triglyceride (TG) and lipoprotein a (LPa) (P<0.05), and a negative correlation between SIRT4 mRNA levels and high density lipoprotein cholesterol (HDL) (P<0.05).
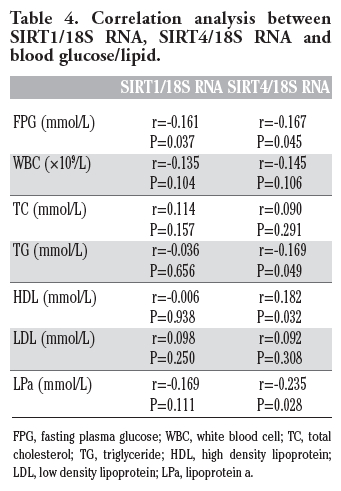 |
Table 4. Correlation analysis between SIRT1/18S RNA, SIRT4/18S RNA and blood glucose/lipid. |
Clinical characteristics of the two groups show that BMI, SBP, DBP, FPG, TG and LPa in the T2DM group were all higher than those in the NC group. The result implies that multiple risk factors associating with aging, including decreased physical activity, weight gain, along with the increase of blood pressure and blood glucose/lipids, may lead to islet β-cell dysfunction, insulin resistance and impaired glucose tolerance, and even lead to the occurrence of T2DM.
Previous studies showed that SIRT1 protein is expressed in liver, brain, kidney, fat and muscle tissues.8 SIRT4 protein is expressed in pancreatic islets,9 but the immunocytochemical staining of this study showed that SIRT1 and SIRT4 are not only expressed in the mentioned tissues, but both of them are also expressed in PBLs (granulocytes, monocytes). Moreover, SIRT1 is expressed in the nucleus and cytoplasm of granulocytes and monocytes, consistent with another study that found that SIRT1 is mainly located in the nucleus, but also in the cytoplasm, and exhibits nuclear - cytoplasm shuttling.11 SIRT4 is mainly expressed in the cytoplasm of granulocytes and monocytes.
Many studies have indicated that SIRTs 1 and 4 take part in both glucose homeostasis and energy metabolism.12 RT-PCR results of this study are also consistent with a previous study on animals.7 Correlation analysis between SIRTs 1 and 4 vs. blood glucose/lipid shows that there is a significant correlation between SIRTs 1 and 4 and FPG, TG, LPa and HDL. All these results confirmed that there is a relevance between the expression of SIRTs 1 and 4 in PBLs and T2DM and blood glucose/lipids.
SIRTs 1 and 4 activity depends on intracellular NAD+/NADH ratio, and nicotinamide13 during calorie restrict (CR) condition or fasting,14 which have shown that SIRTs 1 and 4 are closely related to the regulation of energy metabolism. NAD+/NADH ratio increases as well as the SIRTs 1 and 4 expressions. The NAD+/NADH ratio (or nicotinamide concentration) is likely to be a primary determinant of regulation, and SIRTs 1 and 4 could be regulated by CR in a given cell, since the NAD+/NADH ratio has the potential to equilibrate cellular compartments by shuttle systems.15 The result of this study showed that a high blood sugar level in T2DM patients will decrease NAD+/ NADH ratio, with a subsequent decrease of SIRTs 1 and 4 expressions.
SIRT1 has histone deacetylase activity, acts as a multifunctional transcription factor, and is closely related to life activities, broadly participates in metabolic pathways, regulates the balance of energy metabolism and maintains glucose/lipid metabolism homeostasis in the body. T2DM is a disorder of glucose/lipid metabolism, suggesting there may be a close relationship between SIRT1 and T2DM. Gluconeogenesis glycogen is one of the main factors acting in maintaining high blood sugar in fasting and CR diabetes. In the liver, phos-phoenolpyruvate carboxykinase (PEPCK) is one of the gluconeogenesis rate-limiting enzymes. The PGC1-α protein is a key factor in PEPCK regulation; at the same time, SIRT1 can interact with its substrate PGC1-α, inducing deacetylation of multiple lysine sites therein. Then, PGC1-α interacts with the hepatocyte nuclear factor 24 (HNF24) after deacetylation, contributes to increasing of liver gluconeogenesis gene transcription, and decreasing of glycolysis related genes, thus inhibiting glycolysis. Moreover, SIRT1 promotes gluconeogenesis glycogen and increases the output of glycogen.16 This study shows that there is a correlation between the expression of SIRT1 in PBLs and T2DM, blood glucose/lipids, in agreement with previous studies. The above results imply that SIRT1 expression in PBLs is related to SIRT1 expression in liver cells and may participate in regulating blood glucose as well. A previous study found that, in the fasting or CR cases, SIRT1 expression is elevated in the liver, pancreas, muscle, brain, and adipose tissues of rodents.16 A previous study on animals has shown that in high-sugar or high-fat rat model of insulin resistance, the pancreatic SIRT1 expression is reduced.2 The study is consistent with the results of these experiments, indicating the equivalence of SIRT1 expression in both islet β-cell and PBLs.
Unlike other SIRT family members, SIRT4 has no deacetylation activity. Instead, it has a strong ADP-ribosyltransferase activity and is able to transfer the adenosine diphosphate ribose residues (ADPR) of NAD+ to its protein substrate.9 Moreover, it has been found that SIRT4 can regulate insulin secretion by inhibiting the glutamate dehydrogenase (GDH) activity.6 In SIRT4 knockout mice or in CR, GDH is activated and it up-regulates insulin secretion of β-cell under the amino acid stimulation.10 Based on the above experimental studies, it has been assumed that SIRT4 in pancreatic β-cell may play an opposite effect compared with CR;10 namely, in the high-sugar situation the SIRT4 level increased. However, a previous study on animals has found that SIRT4 expression decreases in the rat model of insulin resistance.7 Consistent with this study, our findings show that SIRT4 expression in T2DM group is significantly lower than that in NC group. Furthermore, a recent study observed a significant increase in gene expression of mitochondrial and fatty acid metabolism enzymes in hepatocytes with reduced SIRT4 levels in SIRT4 knocked-down mice. SIRT4 knockdown increased SIRT1 mRNA and protein levels both in vitro and in vivo as well. The study also showed a significant increase in fatty acid oxidation (FAO) in SIRT4 knockdown primary hepatocytes compared with control in consistent with the increased FAO gene expression, which effect was dependent on SIRT1, and observed a significant increase in hepatic mitochondrial and FAO gene expression, in agreement with the findings in primary hepatocytes. The study demonstrated that SIRT4 inhibition increases fat oxidative capacity in liver and mitochondrial function in muscle, which might provide therapeutic benefits for diseases associated with ectopic lipid storage such as T2DM.17 Therefore, SIRT4 is likely to be associated with T2DM and SIRT4 absence is likely to accelerate the development of T2DM.18 However, further exploration and research are needed as on to identify the possible likeliness of SIRT4 expression in PBLs and islet β-cell, and whether the detection of SIRT4 in PBLs can reflect the function of pancreatic β-cell.
T2DM is also considered to be a systemic chronic inflammatory disease, as it not only exhibits a decline in β-cell function, but also reduces insulin secretion by β-cell and increases blood sugar. At the same time, the presence of leukocytes, which are inflammatory cells, in T2DM reveal a discrepancy of glucose metabolism in PBLs; thus, the PBLs function declines, affecting SIRTs 1 and 4 expression. Therefore, the consistency of SIRT1 expression in islet β-cell and PBLs also shows a correspondence of the two.
This study shows that there is a significant increase in PBLs in the T2DM group compared with the NC group, which indicates that the proliferation, senescence and apoptosis of PBLs, as well as the inflammatory cells, are likely to be associated with T2DM, a systemic chronic inflammatory disease. SIRTs 1 and 4 expression in PBLs is also likely to be affected by the proliferation, aging and apoptosis of PBLs, and then SIRTs 1 and 4 would participate to the development of T2DM, although this needs further studies to be confirmed. The function of pancreatic β-cell can not be detected directly in clinical situations; however, further research should be performed to prove if it can be indirectly identified by the combined detection of SIRTs 1 and 4 in PBLs. Meanwhile, there are significant differences in the expression of SIRTs 1 and 4 between T2DM group and NC group, and this also suggests the relevance between SIRTs 1 and 4 and T2DM.
In summary, our study suggests that SIRTs 1 and 4 may have a role in the pathogenesis of T2DM, and that their expression in peripheral granulocytes and monocytes may provide indirect indication of the altered homeostasis of glucose/lipid metabolism in T2DM.
1. Varady KA, Hellerstein MK. Do calorie restriction or alternate-day fasting regimens modulate adipose tissue physiology in a way that reduces chronic disease risk? Nutr Rev 2008;66:333-42.
2. Chen D, Steele AD, Lindquist S, Guarente L. Increase in activity during calorie restriction requires Sirt1. Science 2005; 310:1641.
3. Gomez-Cabrera MC, Zaragoza R, Pallardo FV, Viña JR.. SIRT1 regulation of insulin-signalling pathways in liver, white adipose tissue and pancreas during fasting or calorie restriction. Trends Endocrinol Metab 2007;18:91-2
4. Milne JC, Denu JM. The Sirtuin family: therapeutic targets to treat diseases of aging. Curr Opin Chem Biol 2008;12:11-7.
5. Picard F, Kurtev M, Chung N, Topark-Ngarm A, Senawong T, Machado De Oliveira R, et al. Sirt1 promotes fat mobilization in white adipocytes by repressing PPAR-gamma. Nature 2004;429:771-6.
6. Kapoor RR, Flanagan SE, Fulton P, Chakrapani A, Chadefaux B, Ben-Omran T, et al. Hyperinsulinism-hyperammonaemia syndrome: novel mutations in the GLUD1 gene and genotype-phenotype correlations. Eur J Endocrinol 2009;161:731-5.
7. Chen YR, Fang SR, Fu YC, Zhou XH, Xu MY, Xu WC. Calorie restriction on insulin resistance and expression of SIRT1 and SIRT4 in rats. Biochem Cell Biol 2010; 88:715-22.
8. Kume S, Uzu T, Kashiwagi A, Koya D. SIRT1, a calorie restriction mimetic, in a new therapeutic approach for type 2 diabetes mellitus and diabetic vascular complications. Endocr Metab Immune Disord Drug Targets 2010;10:16-24.
9. Yu J, Auwerx J. The role of sirtuins in the control of metabolic homeostasis. Ann N Y Acad Sci 2009;1173:E10-9.
10. Haigis MC, Mostoslavsky R, Haigis KM, Fahie K, Christodoulou DC, Murphy AJ, et al. SIRT4 inhibits glutamate dehydrogenase and opposes the effects of calorie restriction in pancreatic beta cells. Cell 2006;126: 941-54.
11. Taylor DM, Maxwell MM, Luthi-Carter R, Kazantsev AG.. Biological and potential therapeutic roles of sirtuin deacetylases. Cell Mol Life Sci 2008;65:4000-18.
12. Rodgers JT, Lerin C, Haas W, Gygi SP, Spiegelman BM, Puigserver P. Nutrient control of glucose homeostasis through a complex of PGC-1alpha and SIRT1. Nature 2005;434:113-8.
13. Nisoli E, Tonello C, Cardile A, Cozzi V, Bracale R, Tedesco Let al. Calorie restriction promotes mitochondrial biogenesis by inducing the expression of eNOS. Science 2005;310:314-7.
14. Lin SJ, Ford E, Haigis M, Liszt G, Guarente L. Calorie restriction extends yeast life span by lowering the level of NADH. Genes Dev 2004;18:12-6.
15. Haigis MC, Guarente LP. Mammalian sirtuins--emerging roles in physiology, aging, and calorie restriction. Genes Dev 2006;20:2913-21.
16. Al-Regaiey KA, Masternak MM, Bonkowski M, Sun L, Bartke A. Long-lived growth hormone receptor knockout mice: interaction of reduced insulin-like growth factor i/insulin signaling and caloric restriction. Endocrinology 2005;146:851-60.
17. Nasrin N, Wu X, Fortier E, Feng Y, Bare' OC, Chen S, et al. SIRT4 regulates fatty acid oxidation and mitochondrial gene expression in liver and muscle cells. J Biol Chem 2010;285:31995-2002.
18. Mahlknecht U, Voelter-Mahlknecht S. Fluorescence in situ hybridization and chromosomal organization of the sirtuin 4 gene (Sirt4) in the mouse. Biochem Biophys Res Commun 2009;382:685-90.
[TOP]